- FinTech

Administration and Audit Challenges Solved for Investec’s Capital Markets Trading Infrastructure
Investec was enduring administration and audit challenges.
meshIQ provides full lifecycle support for Java applications and web servers including observability, monitoring, transaction tracking, and performance regression testing using bytecode instrumentation, JMX monitoring and management.


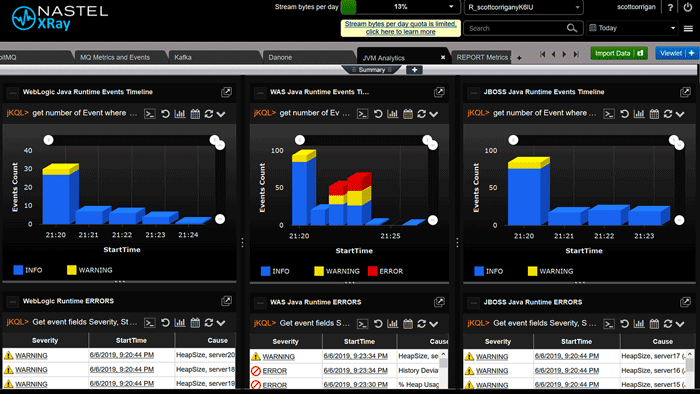
Monitor application processes at the most granular levels from a single enterprise-wide dashboard. Automatically detect and correct errors and failures before they impact your application process flows. Capture extensive information on application performance enable proactive performance tuning, load balancing, and capacity planning to maximize the availability and reliability of your business applications. Extend the powerful monitoring and control functions of the meshIQ platform to all of your Java applications.
Rapid Instrumentation
Rapid Instrumentation of Java applications using a straightforward GUI (Graphical User Interface) Wizard.
Integration
Integration with the meshIQ Platform’s sophisticated rules and notification engine.
Access attributes
Access to Java application attributes and actions.
Monitoring and controlling JMX-enabled applications
Monitoring and controlling any JMX-enabled applications with virtually no coding required.
Events and Alerts
Generation of customized, context-relevant events, alerts and actions.
Hosting
Hosting customized JMX MBeans via its JMX agent.
Web Application Servers
Supports all web applications e.g. WebSphere Application Server, JBoss, WebLogic.
360° Situational Awareness
The view is completed by including metrics from the operating system, log files, and an API that allows the application to write directly into the monitoring database to be included in complex event processing and alerting.
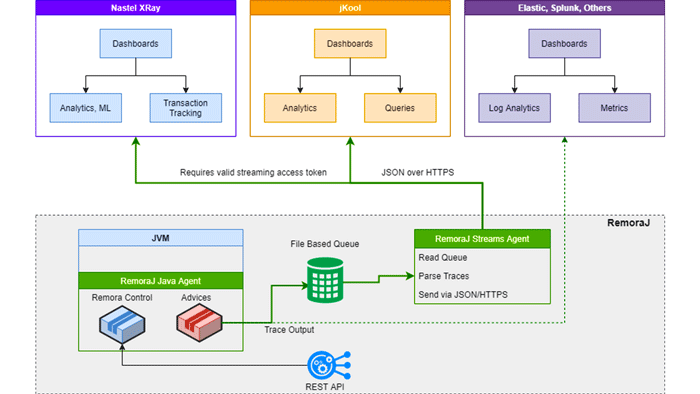
RemoraJ is an open source, low overhead extensible Java Bytecode agent. Gain visibility into what’s coming in and out of your Java apps by tracking calls such as HTTP, Web Services, JDBC, JMS, Sockets, WebSocket, IO Streams, Kafka, and other inter JVM/IPC communications. Connect calls across JVM with RemoraJ message correlators.
Profiling with low overhead
Profile apps during load, integration, and production with low overhead. RemoraJ instruments only critical portions of your code.
Track Java IPC
See what is coming in and out of the java apps: HTTP, WebSockets, IO Streams, JDBC, JMS, and more.
Dynamically enable/disable profiling
Turn instrumentation on/off without restarts, on-demand using programmable APIs (REST). Why has profiling been enabled all the time? For example: Run a curl command and enable/disable HTTP intercept on the fly. Gather your traces and analyze results.
Stack trace and heap dumps
Generate stack traces or heap dumps remotely during problem determination.
Fully programmable, extensible
Control RemoraJ via REST API, build extensions, and integrate with your tools.
Built by developers for developers & performance engineers
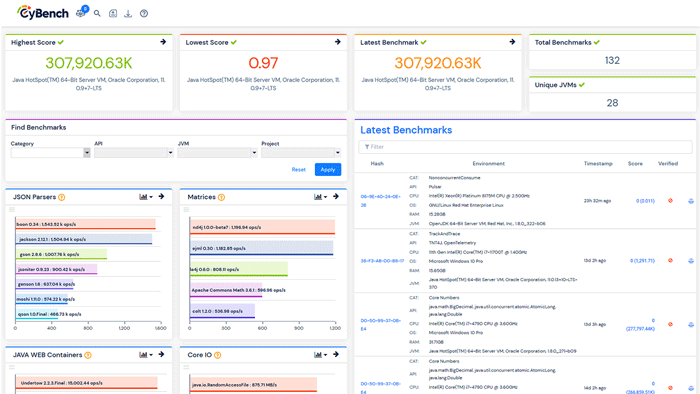
Use meshIQ CyBench for running performance benchmarks on Java applications as part of a CI/CD pipeline.
It looks at the new code that you’ve written as well as new versions of open source packages that you’ve added and identifies increased response times and decreased throughput.
Do you know which open-source project has the best performance profile for your app? What you choose will greatly impact the performance and reliability of your project.
It can be a difficult choice unless you have a way to benchmark and compare available options and help you make the right decision.
Benchmark your Java stack:
CyBench your code across releases, containers, virtual machines, SDK’s, JDK’s and use the most optimal code-library combination.
CyBench is a code benchmark platform based on JMH, designed to help developers build better, faster Java code.
Test your Java code and 3rd party libraries in minutes. Get a performance score for each build/release, measure performance overhead across builds and releases.
Download and run here: https://cybench.io/download/
Investec was enduring administration and audit challenges.